
All patents are not same. There is significant variance in their technical and commercial value. Empirical research (Pakes and Schankerman, 1986) has shown that half of the estimated patent value belongs to 5% of the entire patent population. More recently, based on survey data, Gambardella and Harhoff (2008, p. 79) found the mean value of a European patent to be about three million euros. The median value was roughly 300,000 euros and mode value only about 6000 euros. Owing to such skewed distribution of value, empirical research seeks to create measures that separate the wheat from chaff.
The literature (Trajtenberg, 1990) has differentiated between the private and social value of patents. The social value represents the net value created by the patented invention for social welfare. Private value is defined as the extra revenue generated by the patent over its lifetime for the patent holder.
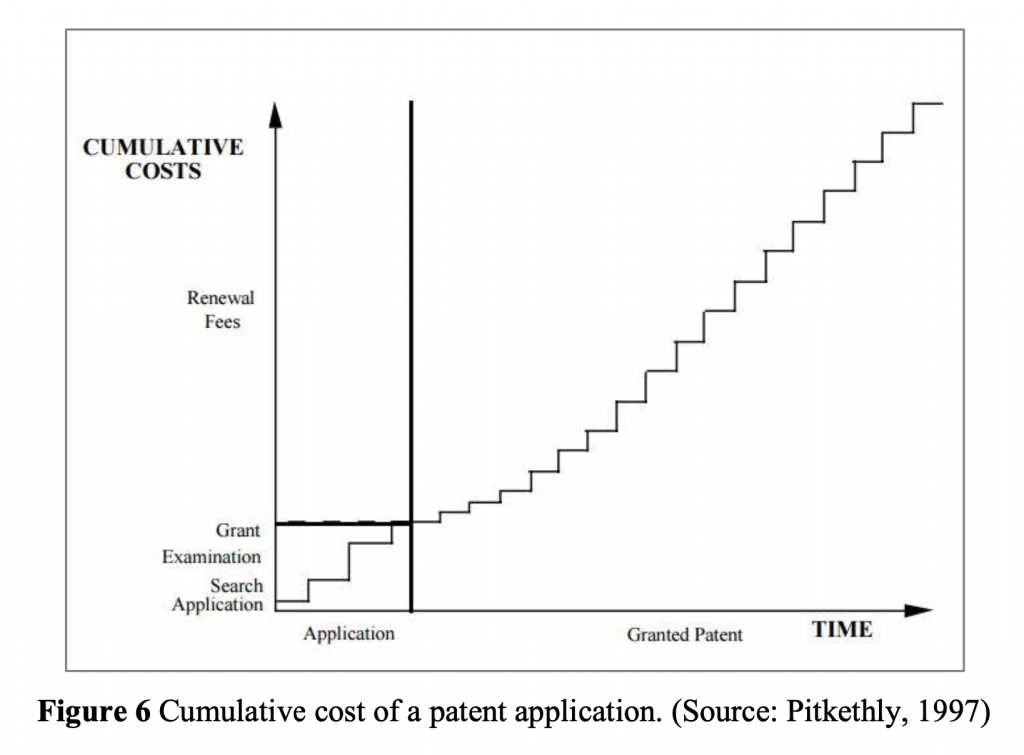
For managers to make well founded management decisions, it is important to have a fairly accurate estimate of the value of an invention. Applying and maintaining a patent is a cumulatively increasing cost (Figure 6). There are four major decision points faced by managers during the course of developing an invention. These are: (i) whether to file a patent application? (ii) Whether to continue with the patent filing following patent office actions? (iii) Whether to maintain a granted patent in force by paying renewal fees? (iv) How to exploit a granted patent? (Pitkethly, 1997)
The three classical methods of monetary valuation of patents are cost-based, market- based, and income-based methods. Cost based method relies on the estimate of actual costs incurred in creating the patented invention. The income approach attempts to quantify the discounted future cash flow forecast of the patent’s potential commercial use. The market approach estimates value based on a similar transaction accomplished in the past. (OECD, 2005)
Economics and management scholars, however, are concerned with patent-based indicators that signal value (or other constructs of interest). This is because they are concerned with questions related to policy, organization, management and strategy. The treatment of patent information is therefore done at a more aggregated level. Patent-based indicators have been repeatedly proven in the literature to be correlated to patent value. The patent value indicators have been validated by correlating them to (i) surveys asking inventors for perceived value of their innovations (Scherer et al., 2000); (ii) market or financial data (Hall et al., 2005); (iii) incidences of disputes (Harhoff et al, 2003); (iv) auction prices of patent transactions (Fischer and Leidinger, 2014); and more.
Patent value indicators churned out by researchers over time were put into four categories by Zeebroeck and van Pottelsberghe (2011). These were (i) Patent characteristics – these deal with the characteristics of the patent applications, for example, number of references in the patent document; (ii) Patent ownership – this category deals with characteristics of patent owners or applicants, for example, past portfolio size of applicant; (iii) Insider information – these indicators are theoretical and are created using qualitative interviews and surveys pertaining to the context of the invention; (iv) Filing strategies – they refer to filing strategies, patenting route selected, procedural indicators, etc.
Patent characteristics
Number of claims
The average number of patent claims can help in determining the breadth and scope of the invention (van Zeebroeck, et al., 2009). Experts opine that the legal proceedings related to patent infringements are invariably solved by an evaluation of the claims. Typically, claims are divided into two types: independent or dependent. Independent claims are known to enhance the scope of an invention. Dependent claims usually provide more information and are built around independent claims. “… They operationalize what patent attorneys call fall-back options for legal disputes” (Reitzig, 2004). My own interviews have revealed that text of claims is more important than their numbers. However, it is difficult to achieve a broad enough scope with just one claim. This makes publication claims an important factor in determining the quality of the patent portfolio. The EPO allows up to 15 claims in a published patent. Any extra claim that a patentee wants to add has to be paid for (EPO, 2013). If an inventor is willing to pay for the extra claims, it can be inferred that the relevance of the patent in question is high or at least the applicant feels paying extra money will enhance the core scope of the invention. One of the major advantages of assessing the number of claims is the fact that this indicator is available early in time as soon as the patent is published. Empirical work has proven “number of claims” to be significantly associated to patent value (Lanjouw and Schankerman, 1997; Bessen, 2008). A detailed discussion on strategic aspects of drafting patent claims is avoided here as “number of claims” is only used as a control variable for legal scope of a patent.
Number of technical classes
Each patent application is technically classified into specific technology areas related to the invention. It is a hierarchical way of assigning the category to which a patent belongs and is known as International Patent Classification (IPC) classes. Number of IPC classes attributed to a patent application has been used as a proxy for the scope, and hence the market value of a patent (Lerner, 1994). It has also been argued in the literature that IPC classes have little or no association with the value of the patent rights (Lanjouw and Schankerman, 1997; Harhoff et al., 2003). Empirical literature has however used “number of IPC classes” as suggestive of technological diversity of a patent (Guellec and van Pottelsberghe 2000, 2010). Number of IPC classes have been used as a control for technical scope of inventions in some papers related to this dissertation.
Citation based indicators
Patent citations are references considered important by the patent examiner in determining the novelty and inventive step of a patent application. References made to previous patents are called backward citations, and references received from future patents are called forward citations. Cumulative and knowledge transfer indicators use backward citations, and impact-type indicators are based on forward citations (OECD, 2009). The history of citations in patents dates back to 1947 when examiners in United States Patent and Trademarks Office (USPTO) began citing references considered during the examination process (List, 2010). Researchers have a long history of using citation based indicators. This has helped identify many pitfalls in the use of citation indicators that are addressed in the data analysis pertaining to the thesis. Some of the key issues related to citation analysis are presented below.
Country and industry variations
Citation practices differ significantly across patent offices and across technology fields. For example, US patents contain three times more references as EPO patents (Michel and Bettels, 2001). This is because European guidelines require examiners to list only the most important references. As a result, the jurisdiction for analysis has been restricted to EPO for most of the studies related to this dissertation.
Right truncation
Forward citation analysis suffer from the phenomenon of ‘right truncation’. More recent patents cannot be analysed as only citations received so far are known (Hall, et al., 2001). A common practice adopted by researchers to counter this issue is to count citations received only in the first 5 years of patent filing.
Multiple citations to family members
Patent documents citing each other may not have a one-to-one relationship to inventions. A given invention can be covered by a number of documents issued by national, regional or supranational offices. Sometimes, different family members that cover the same invention are cited by different examiners. To account for this underestimation, forward citations are counted at the family level (count of families citing families). (OECD, 2009)
Home and language bias
Examiners may succumb to home bias as they are more likely to cite documents from the same office or documents that maybe easy to find / understand (Alcacer and Gittelman, 2006).
Forward and backward citations
Forward citations are citations received by a patent from subsequent patents. More valuable or impactful patents are usually associated with higher number of forward citations. Forward citations has been found to be the most stable indicator of patent value in the literature. Studies have shown that forward citations are strongly correlated to economic value of patents (Trajtenberg, 1990) as well as the social value of inventions (Scherer et al., 2000). Renewal of patents is correlated to high count of forward citations (Putnam, 1996). Lanjouw and Schankerman (1997) showed that patents which receive more citations than average are more likely to be opposed or litigated.
Backward citations, or references added to a patent during patent examination, can potentially provide insights into the exploration process of new technologies (Jaffe, Trajtenberg and Fogarty, 2000; Lukach and Plasmans, 2002). The idea behind utilizing backward citations as a value determinant is in the assumption that combination and knowledge transfer from other technological domains would lead to more valuable patents (Nemet and Johnson, 2012). Backward citations have been a subject of debate among patent value researchers. The results of using backward citations as a value determinant have provided ambiguous results (Hall et al., 2001; Zeebroeck et al., 2011b).
References added to a patent application need not be only to other patent documents. Non- patent literature (NPL) refers to scientific articles in journal and conferences, along with other sources like books, internet links, abstract services, disclosure bulletins, and the like. A large number of NPL citations has been associated with a greater linkage to fundamental scientific research (Narin and Olivastro, 2006; Callaert et al., 2006).
Citation categories
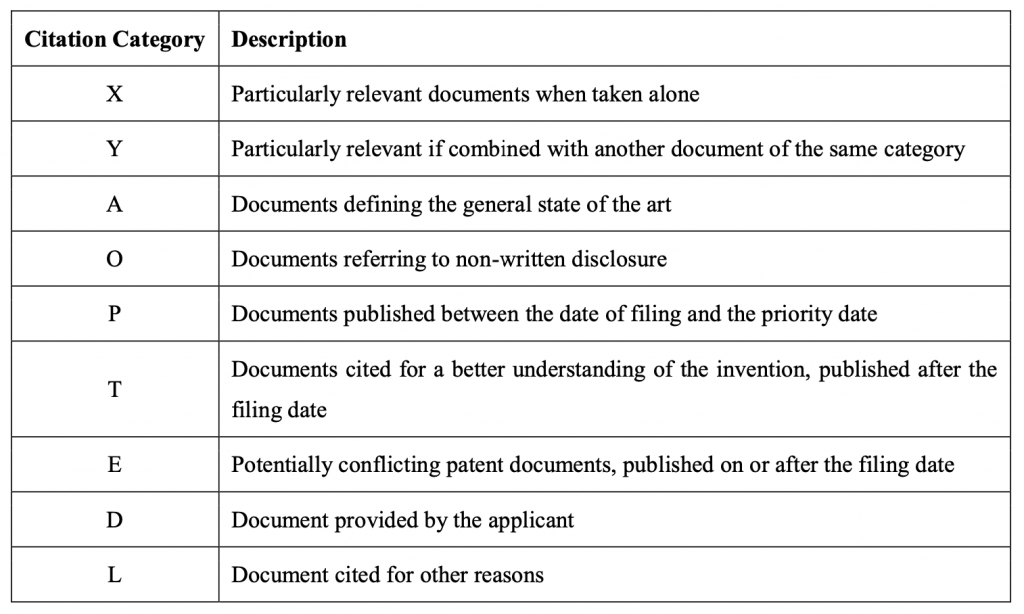
The EPO examination guidelines7 require all cited documents to be identified by a certain letter or a combination of letters. Citation categories are a useful way of assigning relevance to citations. Table 2 below lists some of the most common categories used. X, Y and A are by far the most used categories. Documents assigned X indicate a clear similarity between the claimed invention and the contents of the cited document. Y refers to documents that can be combined with other documents by a skilled person to develop a concept similar to the claimed invention. Documents ascribed A refer to citations that define the state of the art, but are not in conflict with the claimed invention. In simpler terms, an X reference indicates overlapping claims with a previous document; a Y reference means a combination of multiple Y documents can anticipate the claims of the patent being examined; and an A reference mostly defines the state of the art. Previous literature (Czarnitzki, et al., 2011; Harhoff and Wagner, 2009) has combined X and Y references and called them blocking citations. ‘A’ references are usually added by examiners if they are considered useful for the applicant when modifying claims.
Citation origin
Citations can be added to a patent document during different stages of the examination process. Most citations are added during the search phase. Some applicants may request a supplementary search report that may generate more references. Where necessary, these search reports are supplemented by the examiner and/or by third party observations during pendency. Even post-grant opposition and appeal proceedings might uncover and add prior art that may have been overlooked. For PCT applications entering Europe, citations should also be analysed from the International Search Report (ISR) that is generated by the patent office where the application originated.
Procedural indicators
Procedural indicators refer to actions made at the patent office by applicants or other stakeholders. They do not related the characteristics of the patent but with the office procedure. In the past, patent renewal information has been used to estimate the value of patents (Pakes and Schankerman, 1984; Pakes, 1986). The renewal fee of patents generally keeps increasing as the patent approaches its full term, although the extent varies between patent offices. There are limitations associated with using patent renewal as a value indicator. The renewal information comes late in the patent lifecycle which makes it impossible to analyse more recent patents. Sometimes, the decision to renew or not to renew can be based on circumstances beyond the scope of economic patent value like change in organizational goals or external shocks.
The actions of applicants and third parties related to pending patent applications have more recently caught the scrutiny of researchers. Zeebroeck and Pottelsberghe (2011b) showed filing routes, drafting styles and divisional applications are associated to patent value. Berger, et al. (2012) found essential patents in industries having standards were associated with longer pendency times as a result of multiple amendments to their claims. Gambardella et al. (2007) used third-party observations presented during pendency of EPO patents as a measure of “economic value of technology.” They found that patents characterized by third-party observations were more likely to be licensed. Reitzig (2004) confirmed that accelerated examination request made by applicants are associated with patents of higher value. The impact of accelerated examination requests on opposition has also yielded positive and significant results in Jerak and Wagner (2006).
The European Patent Register database used in this thesis tracks every interaction made between the patent office and the applicant for EPO patents. This gives researchers a peek into the detailed nuances of the patent pendency process. Harhoff and Wagner (2009) have used some of these nuances to look for determinants of the duration of patent examination at the EPO. I will make a brief review of these instruments.
Opposition and litigation
The EPO opposition procedure is an important procedural tool used by third parties to invalidate or restrict patent grants considered weak. Opposing a patent is a costly procedure and it has been hypothesized in the literature to be strongly associated to patent value (Harhoff et al., 2003). These authors have shown that only 8% of EPO patents are involved in post-grant opposition by third parties. This shows the low percentage of valuable patents that represent conflicting commercial interests. Opposition rates in different patent systems were compared by Graham et al. (2002) which revealed that the average re-examination rate in EPO is much higher than the USPTO.
The costs associated with pursuing patent litigation in courts can be significantly higher than the central EPO opposition procedure. The cost of filing an opposition at the EPO is only €785 (2016 figures). The total cost of opposition to each parties can be between €10000 to €25000 including attorney fees and other indirect costs (Graham and Harhoff, 2006). Litigation costs can be much higher. WIPO (2009) estimates a minimum cost for £350,000 for a typical lawsuit in the UK. The EPO opposition system is the only time when a patent grant can be challenged centrally. Once the period of nine months post grant has elapsed, or the opposition is formally closed, a patent can only be challenged in national courts. This makes an EPO opposition a useful forum for third parties to annul patents that maybe weak or invalid.
Accelerated examination requests
According to EPO examination guidelines, an accelerated examination can be requested by the applicant at any time. In the event of such a request, the EPO does its best to issue the first examination report in less than three months. There are two classic reasons for expediting the patent prosecution process. One is to obtain a patent right and prevent infringement by a potential infringer. The other is to obtain a patent grant quickly to negotiate investments and licenses. These two reasons suggest that accelerated examination requests capture (i) the applicant’s quest to achieve greater certainty related to their patent’s validity and (ii) their belief that the invention is valuable or close to commercialization. Given the extra costs associated with this procedure and the self- selection applicants submit themselves to, accelerated examination requests could signal value to third parties (hence increasing the likelihood of opposition) and increase the likelihood of applicants to litigate once the patent is granted.
Amendments
We used the European Patent Register database to check for patents that have events related to their amendment. Any amendment made to the description or claims is recorded in the register. As per article 123 of the European Patent Convention (EPC), these amendments are those made by applicants of their own volition. The amendments may not, in any way, extend beyond the subject matter of the originally filed application, which is usually formulated in broad and vague fashion. Discussions with experts have revealed that amendments are usually made in a restrictive way to clear way for a grant. The only empirical work I know on amendments have been done by Berger, et al. (2012). These authors have shown that patents declared as ‘standard essential’ were more likely to be amended during patent prosecution. They conjectured that this could be because applicants participating in standard setting processes try to custom-fit claims to suit the standard.
Divisional applications
According to Rule 36 of the EPC, an applicant may file a divisional application at the EPO as long as the parent application is pending, i.e., not granted, refused, or revoked. The usual reason for filing a divisional application is that the parent application does not satisfy the requirements as to the unity of invention and the applicant is not content with limiting it. Applicants sometimes use divisional applications to isolate a “surer” part of the application or to proceed with the examination in several parallel tracks.
From a strategic point of view, applicants may use divisional applications as means of understanding what subject matter will be allowed as a patent right for a perceptibly important invention. As a result, third parties may be kept in uncertainty over the exact nature of rights granted to an invention.
Third party observations
According to article 115 of the EPC, any third party is allowed to present observations concerning the patentability of an invention. The EPO is obliged to forward all such observations to the patent applicant. The usual grounds on which third parties can file such observations include lack of novelty, lack of clarity or sufficiency of disclosure, and/or unallowable amendments. Such observations are a rare but interesting event. They are the first evidence that third parties are interested in an application or even potentially vexed by it. These observations can be indicative of an invention’s market value and the presence of stakeholders with conflicting interests.
According to Akers (2000, p. 313), “As a possible disincentive to the filing of observations, it should be realized that observations could give an applicant forewarning of a competitor’s interests…” Given the risk to which third parties expose themselves, such observations should therefore be indicative of higher stakes involved for third parties. Third parties also bear the additional risk of their observations helping the patentees to modify their claims accordingly to still achieve a grant. One might argue in particular that if the third-party observations are not sufficient to prevent the patent from being granted, the chances are particularly high that the third party will challenge the patent’s validity in an opposition procedure.
Thanks for sharing, very precise description of each parameters.
Really appreciate the comment, thank you!